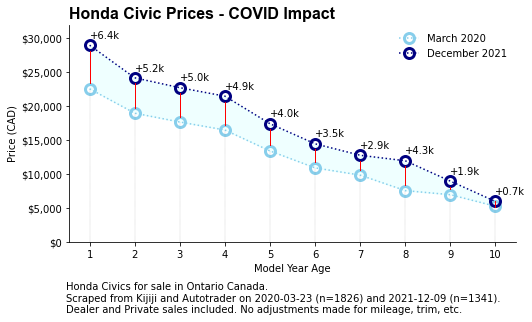
Honda Civics and the Pandemic
In early 2020 I was car shopping. In fact I'm nearly always car shopping. My plans change regularly ‐ one moment I think a 2 seat roadster is the right choice, the next I'm looking at trucks. Endless hours searching for different options, checking for new listings or reduced prices.
To support my car shopping addiction, I built a python script to pull ads from the two popular listing sites in Canada: kijiji.ca and autotrader.ca.
On March 23rd 2020, I was looking at Honda Civics. I pulled over 1800 ads with basic information such as year, price, and mileage. I eventually bought a totally different vehicle (not surprising), but the dataset provides a glimpse into the used Honda Civic market at the dawn of the COVID-19 pandemic.
Nearly 2 years later on December 9th 2021, I decided to re-run the script. The car market had been a regular news topic over the pandemic (more here or here), and I wanted to analyze it.
I found that prices went up… a lot.
For about the same car ‐ in terms of age ‐ you are now paying thousands more. The percentage increase is around 30% across all model ages.

This is quite the anomaly. Cars are supposed to lose value as they age, not gain. For example this analysis shows that for 2017 Civics (model year age 3 in 2020, 4 in 2021) prices actually increased from $17.7k to $21.5k despite getting another year older.
I for one hope this trend reverses. My attainable dream-cars have now become less attainable.